"Currently working as a Data Analytics Trainer with over 8 years of professional experience in the IT and data analytics industry. Successfully mentored and placed more than 100 students in Data Analyst and related roles across the globe. A certified data analytics professional, specializing in data visualization, statistical analysis, SQL, Python, Excel, and BI tools like Power BI and Tableau. With a strong focus on hands-on, real-world scenarios, the training ensures that students gain practical experience in data cleaning, exploration, and interpretation. The course is designed to equip students with the technical and analytical skills required to thrive in data-driven careers. Personalized guidance, resume preparation, and mock interviews are provided to help students secure high-paying jobs in the field of data analytics".
-------------------------------------------------------------------------------------------------------------
-------------------------------------------------------------------------------------------------------------------------------------------
KLabs IT, located in Marathahalli, Bangalore, offers an industry-focused data analyst course in Bangalore designed to equip individuals with the essential skills and knowledge needed to excel in the field of data analysis. This comprehensive program is tailored for aspiring professionals and working individuals seeking to enhance their expertise in managing and analyzing data. The best data analyst course in Bangalore covers a well-structured curriculum that begins with the fundamentals of data analysis, including data cleaning and preparation, statistical analysis, and exploratory data techniques. Participants gain hands-on experience with industry-standard tools such as Microsoft Excel, SQL, Python, and R to process and analyze complex datasets efficiently. Advanced topics such as data visualization, dashboard creation using tools like Tableau and Power BI, and data storytelling are included to ensure participants can present actionable insights effectively. This program also delves into the basics of machine learning, introducing concepts such as regression, classification, and clustering to give participants a competitive edge. Real-world scenarios and live projects are integrated into the training to provide practical experience and build problem-solving skills. The data analyst training in Bangalore emphasizes job readiness by including resume building, interview coaching, and mock interviews. KLabs IT's data analyst course in Bangalore is delivered by highly experienced trainers who offer personalized guidance to each participant throughout the program. Daily classes are complemented with practical assignments to strengthen understanding and application of concepts. The training is suitable for recent graduates, working professionals, or anyone seeking a career transition into the rapidly growing field of data analytics. Post-completion, participants receive an industry-recognized certification, enhancing their employability. With a proven track record of successful placements and a 100% placement guarantee, KLabs IT ensures that its students are ready to thrive in the competitive job market. Enroll in KLabs IT’s best data analyst course in Bangalore today and take the first step toward building a successful career in the high-demand field of data analytics. Whether you're just starting out or looking to upskill, this program is your gateway to mastering the art of analyzing and interpreting data for strategic decision-making. The scope of an Online Data Analyst Course in Bangalore is rapidly growing, with businesses across industries relying on data-driven insights. Skilled data analysts are in high demand to interpret data, optimize processes, and drive business decisions. KLabs IT, a leading Data Analyst Training Institute in Bangalore, provides expert-led online training covering Excel, SQL, Python, Power BI, and Tableau. Our hands-on approach ensures job-ready skills through real-world projects. If you're looking for the Best Online Data Analyst Course in Bangalore, KLabs IT offers flexible learning, industry-recognized certification, and 100% placement support. Enroll today to kickstart your data analytics career!
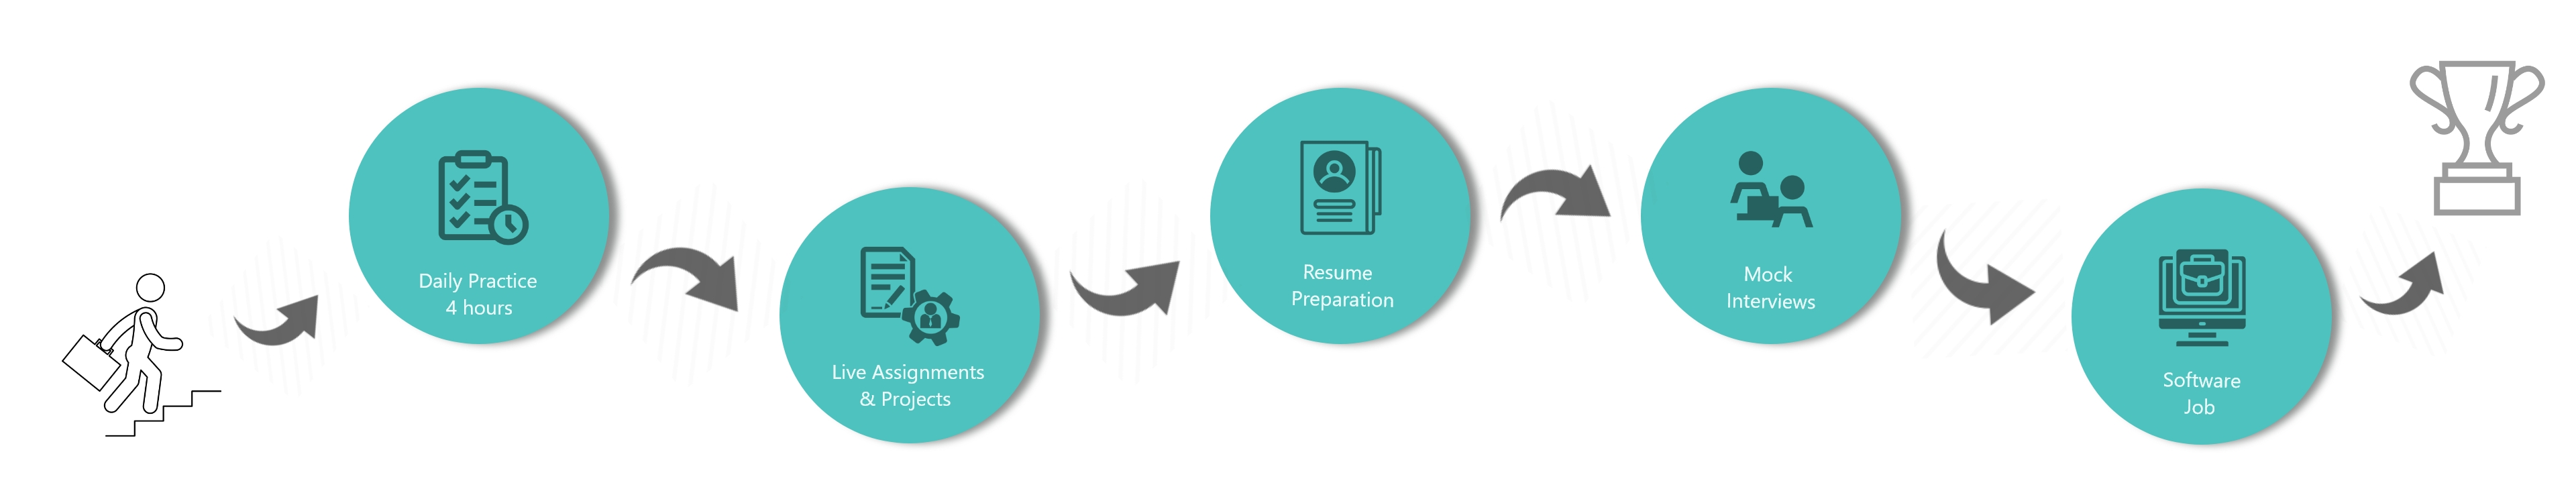
KLabs IT is the ideal choice for pursuing an Online/Offline Data Analyst course due to its industry-relevant curriculum and expert trainers. Located in Bangalore, KLabs IT offers hands-on training in data analysis tools like Excel, SQL, Python, and Tableau, along with advanced concepts such as machine learning basics and data storytelling. Students benefit from live projects, personalized guidance, and a focus on real-world applications. The institute provides comprehensive career support, including resume preparation, mock interviews, and a 100% placement guarantee. With a proven track record of success and industry-recognized certification, KLabs IT ensures students are job-ready and future-focused in data analytics.
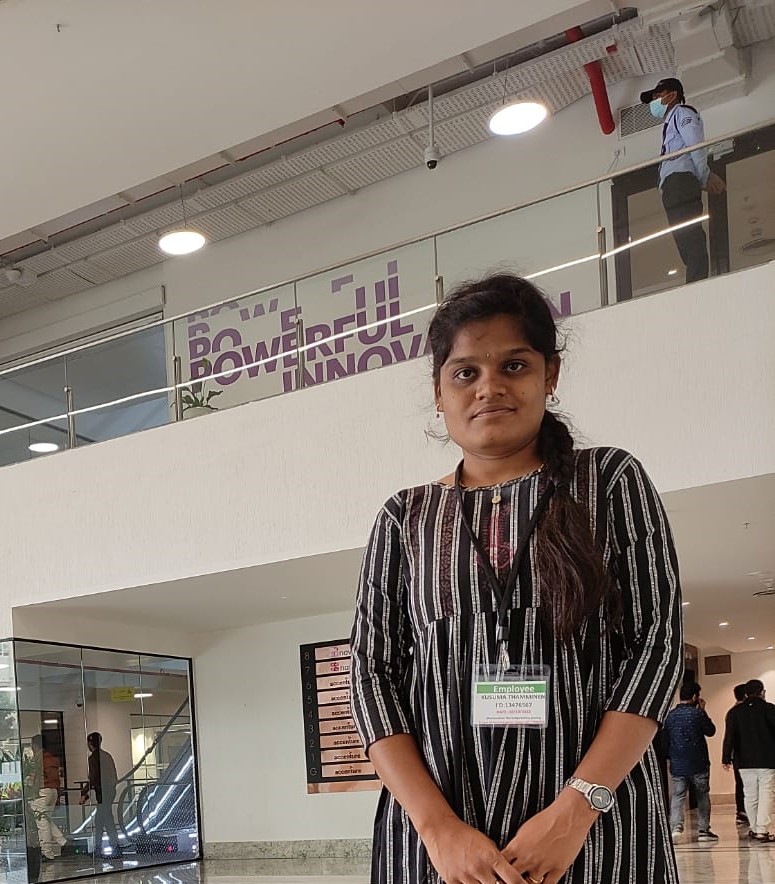
Completing the Online/Offline Data Analyst course at KLabs IT ensures a strong foundation for your career with a 100% placement guarantee. The institute partners with leading companies to provide students with lucrative job opportunities in data analytics. After training, students receive comprehensive career support, including resume preparation, interview coaching, and mock interviews, to excel in recruitment processes. KLabs IT’s focus on hands-on projects and real-world skills ensures students are job-ready. Graduates secure roles such as Data Analyst, Business Analyst, and Reporting Analyst in reputed organizations, equipped with industry-recognized certifications and the expertise to thrive in today’s competitive job market.
In conclusion, KLabs IT provides a comprehensive Online/Offline Data Analyst course that equips students with the skills and tools needed to succeed in the dynamic field of data analytics. With hands-on training, live projects, and expert mentorship, students gain practical knowledge to handle real-world challenges. The institute's dedicated placement support, including resume building and mock interviews, ensures graduates are fully prepared to secure rewarding careers. Backed by a 100% placement guarantee and industry-recognized certification, KLabs IT empowers students to excel in roles like Data Analyst and Business Analyst in top organizations. Choose KLabs IT for a successful and future-ready career.
------------------------------------------------------------------------------------------------------------------------------------------
KLabs IT is the best software training institute in Bangalore. We provide trending software courses like Data Science, RPA, Mulesoft Talend, and more. Register for FREE Classes on our site for more information.
Speak to our trainer regarding Enquiry, Career, Domain change, and any other questions.
We are happy to help you !!! Contact us
If you are looking for Data Science Training in Marathahalli, that meets your expectations and works beyond even that, KLabs IT is the one for all your Data Science Training in Marathahalli needs like Online Training and Classroom designed by KLabs IT

The Talend Course assisted me in obtaining my ideal career. This training greatly aided me in understanding the foundations of KLabs IT Institute.

I am pleased to have finished my Talend training with KLabs IT. The institute also helped me to get an offer.

The best Mulesoft training institute in Bangalore focuses on the needs of the Mulesoft community. KLabs IT is listed as one of Bangalore's top Mulesoft training institutes. We offer Mulesoft education for working professionals. Mulesoft training in Bangalore understands the need of the Mulesoft community.

Are you looking for an efficient, cost-effective way to improve your RPA skills? If so, then the RPA Course in Marathahalli at KLabs IT is the right place to begin. Our certification training program offers a high-quality education that will help you become certified as an RPA professional.